 AURSEE
Aursee
Wildfires in Wisconsin
Detected · VIIRS 375 m · Suomi NPP, NOAA-20, NOAA-21 · last 24 hours · updated 2026-10-11 10:26 UTC
Follow Wisconsin: fire alerts by email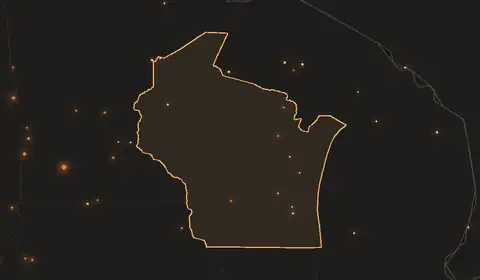
Fire alerts for Wisconsin
Free. One email when satellites detect fire anywhere in Wisconsin, then at most one update a day while fires continue.
Free. Pick a town and we email you when satellites detect fire within 30 km of it.
Fire history, 2012–2025
Detected · VIIRS S-NPP 375 m · 0.01° cells (~1.1 km) · complete years 2012–2025 · built 2026-09-23
Between 2012 and 2025, VIIRS detected fire in 6,460 km² of Wisconsin at least once. In an average year it detected fire in 613 km², ranking 35th of 51 regions of United States.
Year by year
Detected area per year, km². Area of 0.01° cells with at least one detection in the year.
The busiest year was 2024, with 853 km² detected; the quietest was 2020, with 454 km². The 2021–2025 average is 24% higher than the 2012–2016 average.
Through the year
Share of all fire-days 2012–2025 by month. A fire-day is one cell with a detection on one day.
March, April and May together hold 46% of the fire-days in the record. The single busiest day was 25 April 2024, with detections in 68 cells.
Ground that burns again
Of the 6,460 km² with at least one detection, 6.8% had detections in three or more different years.
| Years with a detection | km² | Share |
|---|---|---|
| 1 year | 5,210 | 81% |
| 2 years | 812 | 13% |
| 3 to 5 years | 397 | 6.2% |
| 6 to 10 years | 32 | 0.5% |
| 11 years or more | 10 | 0.2% |
The half-degree square with the most fire-days is centred at 46.75, -92.25 and holds 18% of the region's fire-days.
The figures
Show the table
| Year | Detected km² | Fire-days |
|---|---|---|
| 2012 | 759 | 1,339 |
| 2013 | 467 | 986 |
| 2014 | 508 | 963 |
| 2015 | 691 | 1,210 |
| 2016 | 486 | 953 |
| 2017 | 525 | 1,033 |
| 2018 | 592 | 1,105 |
| 2019 | 484 | 908 |
| 2020 | 454 | 897 |
| 2021 | 693 | 1,288 |
| 2022 | 571 | 1,054 |
| 2023 | 703 | 1,350 |
| 2024 | 853 | 1,517 |
| 2025 | 791 | 1,410 |
Other regions of United States
- Texas13,010 km² in an average year
- Georgia10,210 km² in an average year
- California9,720 km² in an average year
- Florida8,510 km² in an average year
- Kansas6,780 km² in an average year
- Oklahoma6,770 km² in an average year
- How these figures are madeDetected area, cells, and the single-satellite record.
Detected area counts every 0.01° cell with at least one VIIRS detection, so a small fire counts as a whole cell and a fire missed by cloud or between passes is absent. Borders: Natural Earth 1:10m. 2012 begins on 20 January.