 AURSEE
Aursee
Wildfires in Volgograd
Detected · VIIRS 375 m · Suomi NPP, NOAA-20, NOAA-21 · last 24 hours · updated 2026-10-11 10:26 UTC
Follow Volgograd: fire alerts by email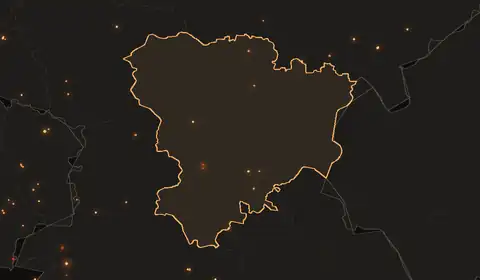
Fire alerts for Volgograd
Free. One email when satellites detect fire anywhere in Volgograd, then at most one update a day while fires continue.
Free. Pick a town and we email you when satellites detect fire within 30 km of it.
Fire history, 2012–2025
Detected · VIIRS S-NPP 375 m · 0.01° cells (~1.1 km) · complete years 2012–2025 · built 2026-09-23
Between 2012 and 2025, VIIRS detected fire in 23,840 km² of Volgograd at least once. In an average year it detected fire in 2,390 km², ranking 24th of 85 regions of Russian Federation.
Year by year
Detected area per year, km². Area of 0.01° cells with at least one detection in the year.
The busiest year was 2014, with 4,560 km² detected; the quietest was 2013, with 1,120 km². The 2021–2025 average is 40% lower than the 2012–2016 average.
Through the year
Share of all fire-days 2012–2025 by month. A fire-day is one cell with a detection on one day.
July, August and September together hold 44% of the fire-days in the record. The single busiest day was 31 July 2014, with detections in 241 cells.
Ground that burns again
Of the 23,840 km² with at least one detection, 8.1% had detections in three or more different years.
| Years with a detection | km² | Share |
|---|---|---|
| 1 year | 17,640 | 74% |
| 2 years | 4,260 | 18% |
| 3 to 5 years | 1,760 | 7.4% |
| 6 to 10 years | 140 | 0.6% |
| 11 years or more | 31 | 0.1% |
The half-degree square with the most fire-days is centred at 48.75, 44.75 and holds 8.0% of the region's fire-days.
The figures
Show the table
| Year | Detected km² | Fire-days |
|---|---|---|
| 2012 | 2,540 | 4,485 |
| 2013 | 1,120 | 2,421 |
| 2014 | 4,560 | 6,940 |
| 2015 | 2,990 | 5,452 |
| 2016 | 1,650 | 3,299 |
| 2017 | 3,530 | 6,015 |
| 2018 | 2,690 | 5,423 |
| 2019 | 2,310 | 4,355 |
| 2020 | 4,370 | 6,638 |
| 2021 | 1,220 | 2,250 |
| 2022 | 1,650 | 2,802 |
| 2023 | 1,520 | 2,727 |
| 2024 | 1,800 | 3,162 |
| 2025 | 1,530 | 2,753 |
Other regions of Russian Federation
- Sakha Republic30,750 km² in an average year
- Krasnoyarsk Krai15,900 km² in an average year
- Zabaykalsky Krai15,080 km² in an average year
- Amur14,950 km² in an average year
- Irkutsk9,420 km² in an average year
- Khabarovsk Krai8,150 km² in an average year
- How these figures are madeDetected area, cells, and the single-satellite record.
Detected area counts every 0.01° cell with at least one VIIRS detection, so a small fire counts as a whole cell and a fire missed by cloud or between passes is absent. Borders: Natural Earth 1:10m. 2012 begins on 20 January.
Nearby regions
- Rostov309 km
- Republic of Kalmykia335 km
- Astrakhan'343 km
- Voronezh397 km
- Saratov427 km
- Luhansk, Ukraine445 km