AURSEE
Aursee · live check
Wildfires near Fortaleza
Updated 2026-10-11 11:27 UTC · VIIRS 375 m, about three hours behind the satellite
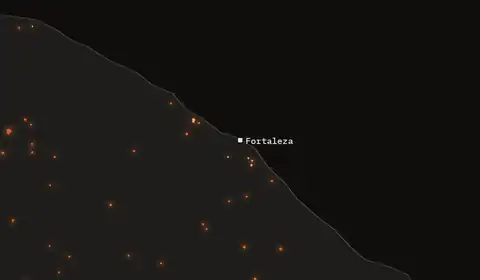
Rings at 50 and 150 km — the same two the counts above use. The blue mark is the coastal point every sea reading on this page is taken at. The rose is the 72-hour mean wind, pointing the way the air is going. Each layer above is its own address, so a view can be shared. Coastline from Natural Earth at 110 m — regional context, not a survey.
Right now
| Power | From Fortaleza | Detections | First seen |
| 1 MW | 17 km SW | 1 | 01:13 local solar |
| 16 MW | 21 km SSE | 6 | 14:11 local solar |
| 82 MW | 40 km WNW | 20 | 13:06 local solar |
| 4 MW | 42 km SE | 1 | 13:08 local solar |
| 18 MW | 43 km W | 2 | 13:05 local solar |
| 4 MW | 46 km S | 1 | 13:27 local solar |
VIIRS 375 m · nearest first; linked entries have a page
Get fire alerts near Fortaleza
Free. One email when satellites detect fire anywhere in Brazil, then at most one update a day while fires continue.
Free. Pick a town and we email you when satellites detect fire within 30 km of it.
When this ground actually burns
Across the last 10 years our archive records 165 days within 25 km of Fortaleza on which fire covered five or more separate square kilometres. By month:
The busiest month in the record is October, with 55 of those days. Counting any burning at all gives 1,136 days and peaks in September: outside summer most Mediterranean detections are agricultural, so that series measures farming rather than fire risk.
375 m heat signatures, about three hours behind the satellite, two passes a day. For evacuation, follow local emergency services.
All destinations · The live map
Conditions
Forecast peak for 2026-10-11. WHO band Very high.
Open-Meteo, daily maximum
Surface temperature for 2026-10-11, sampled 16 km offshore.
Open-Meteo marine model
Vector mean of the last 72 hours: from the ESE at 17 km/h, pushing surface water onto east-facing shores.
At the coastal point stored for this destination, which lies 72° from the centre, that is a onshore component of +14.8 km/h, onshore in 100% of those hours.
Open-Meteo hourly wind at 10 m · 0 h old
NOAA publishes a Sargassum Inundation Risk map for the Caribbean and the Gulf, updated daily. It measures the water offshore; wind decides which of it reaches the sand.
Wind over the last 72 hours has been from the ESE at 17 km/h, pushing surface water onto east-facing shores.
How much weed is on the sand and in the shallows?
NOAA AOML Sargassum Inundation Risk · reports from people at the beach
How this page is put together
Every figure above comes from one of these, and every one of them is redrawn from the live feed each hour.