AURSEE
Aursee
Wildfires in Italy
Detected · VIIRS 375 m · Suomi NPP, NOAA-20, NOAA-21 · last 24 hours · updated 2026-10-11 05:23 UTC
Follow Italy: fire alerts by email
Regions
- Agrigentono fires now
- Alessandriano fires now
- Anconano fires now
- Arezzo1 fire
- Astino fires now
- Avellinono fires now
- Barino fires now
- Barletta-Andria-Tranino fires now
- Bellunono fires now
- Beneventono fires now
- Bergamono fires now
- Biellano fires now
- Bolognano fires now
- Brescia3 fires
- Brindisino fires now
- Cagliari1 fire
- Caltanissettano fires now
- Campobassono fires now
- Carbonia-Iglesiasno fires now
- Casertano fires now
- Catania2 fires
- Catanzarono fires now
- Chietino fires now
- Comono fires now
- Cosenzano fires now
- Cremona1 fire
- Crotoneno fires now
- Cuneono fires now
- Ennano fires now
- Fermono fires now
- Ferrarano fires now
- Florenceno fires now
- Foggia1 fire
- Forlì-Cesenano fires now
- Frosinoneno fires now
- Grossetono fires now
- Imperiano fires now
- Iserniano fires now
- L'Aquilano fires now
- La Speziano fires now
- Latinano fires now
- Lecceno fires now
- Leccono fires now
- Liguriano fires now
- Livornono fires now
- Lodino fires now
- Luccano fires now
- Mantuano fires now
- Materano fires now
- Medio Campidanono fires now
- Messina1 fire
- Milanono fires now
- Modenano fires now
- Monza and Brianzano fires now
- Naplesno fires now
- Novara1 fire
- Nuorono fires now
- Ogliastrano fires now
- Olbia-Tempiono fires now
- Oristanono fires now
- Paduano fires now
- Palermono fires now
- Parmano fires now
- Paviano fires now
- Perugiano fires now
- Pesaro and Urbinono fires now
- Pescarano fires now
- Piacenzano fires now
- Pisano fires now
- Pistoiano fires now
- Pordenone1 fire
- Potenzano fires now
- Pratono fires now
- Ragusano fires now
- Ravennano fires now
- Reggio Calabriano fires now
- Reggio Emiliano fires now
- Rietino fires now
- Rome1 fire
- Rovigono fires now
- Salernono fires now
- Sassarino fires now
- Savonano fires now
- Sienano fires now
- Sondriono fires now
- Syracuse3 fires
- Taranto1 fire
- Teramono fires now
- Terni1 fire
- Trapanino fires now
- Trentinono fires now
- Trentino-South Tyrolno fires now
- Trevisono fires now
- Triesteno fires now
- Turin1 fire
- Udine2 fires
- Varese1 fire
- Veniceno fires now
- Verbano-Cusio-Ossolano fires now
- Vercellino fires now
- Verona1 fire
- Vibo Valentiano fires now
- Vicenza1 fire
- Viterbono fires now
2 fires
Nothing matches.
Fire alerts for Italy
Free. One email when satellites detect fire anywhere in Italy, then at most one update a day while fires continue.
Free. Pick a town and we email you when satellites detect fire within 30 km of it.
Fire history, 2012–2025
Detected · VIIRS S-NPP 375 m · 0.01° cells (~1.1 km) · complete years 2012–2025 · built 2026-09-21
Between 2012 and 2025, VIIRS detected fire in 61,630 km² of Italy at least once. In an average year it detected fire in 9,880 km², ranking 66th of 200 countries.
Year by year
Detected area per year, km². Area of 0.01° cells with at least one detection in the year.
The busiest year was 2017, with 15,220 km² detected; the quietest was 2018, with 6,020 km². The 2021–2025 average is 5.1% lower than the 2012–2016 average.
Through the year
Share of all fire-days 2012–2025 by month. A fire-day is one cell with a detection on one day.
July, August and September together hold 58% of the fire-days in the record. The single busiest day was 25 July 2023, with detections in 685 cells.
Ground that burns again
Of the 61,630 km² with at least one detection, 30% had detections in three or more different years.
| Years with a detection | km² | Share |
|---|---|---|
| 1 year | 30,320 | 49% |
| 2 years | 12,900 | 21% |
| 3 to 5 years | 14,680 | 24% |
| 6 to 10 years | 3,340 | 5.4% |
| 11 years or more | 394 | 0.6% |
The half-degree square with the most fire-days is centred at 40.75, 17.25 and holds 6.0% of the country's fire-days.
The figures
Show the table
| Year | Detected km² | Fire-days |
|---|---|---|
| 2012 | 14,820 | 24,592 |
| 2013 | 8,400 | 15,815 |
| 2014 | 9,050 | 16,778 |
| 2015 | 8,520 | 15,352 |
| 2016 | 9,510 | 16,388 |
| 2017 | 15,220 | 25,737 |
| 2018 | 6,020 | 11,970 |
| 2019 | 9,660 | 17,044 |
| 2020 | 9,350 | 16,400 |
| 2021 | 12,150 | 20,924 |
| 2022 | 8,370 | 15,289 |
| 2023 | 10,950 | 18,236 |
| 2024 | 6,280 | 11,240 |
| 2025 | 9,970 | 16,695 |
Nearby countries
- Russian Federation212,570 km² in an average year
- Ukraine35,560 km² in an average year
- Romania7,650 km² in an average year
- Spain5,090 km² in an average year
- France3,350 km² in an average year
- Bulgaria3,180 km² in an average year
- How these figures are madeDetected area, cells, and the single-satellite record.
Detected area counts every 0.01° cell with at least one VIIRS detection, so a small fire counts as a whole cell and a fire missed by cloud or between passes is absent. Borders: Natural Earth 1:10m. 2012 begins on 20 January.
Nearby countries
- Montenegro254 km
- Albania274 km
- Bosnia and Herzegovina290 km
- Croatia343 km
- North Macedonia381 km
- Kosovo399 km
Travel checks here
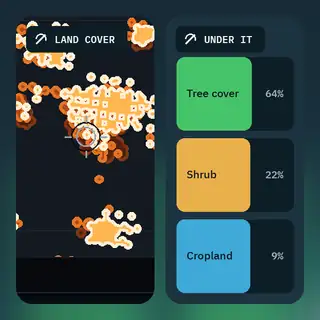
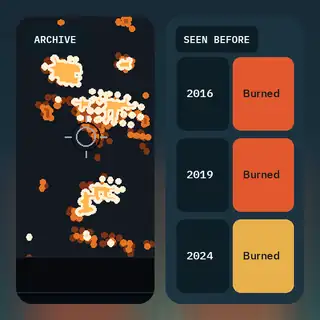
What sits behind each of these fires
Attached to every fire in the list above, and redrawn hourly.